Download from
http://www.nyangau.org/trendserver/trendserver.zip.
TrendServer provides a handy way for exposing trending information via a web server, in graphical form.
You set up some kind of periodic monitoring script on the target host, to generate a log file of samples (in a simple documented format). TrendServer on this target host can read this file and graph the data within.
Alternatively, if the data is made accessible at a given URL by a web server, a remote TrendServer can access and display the data. This means that in a distributed environment, each monitored host only need capture samples and expose it via a (potentially trival) web server process. All the TrendServer code, and its configuration files can be held on a central monitoring host.
Any instance of TrendServer can be made to serve the samples it is using. So you could deploy TrendServer onto each target, allowing you to monitor each target by pointing a browser at it, whilst retaining the ability to monitor lots of targets from a central host.
This server can be configured to obtain data from a number of datasources. The set of datasources is set in properties prior to starting the server. Datasources might correspond to hosts being monitored.
The server can display data pertaining to a number of resources. A resource is something that may be consumed on a monitored host, and for which there is a finite amount available. Examples might be physical memory or %CPU.
Each datasource is assumed to be sampling at a given sampling interval. This is usually insignificant, as each sample is assumed valid until the next. However, if one sample follows another by more than the interval, it is assumed that the first sample occurred, and then there was a period of no sampling, until the following sample appeared.
Each datasource has a set of consumers who may consume the resources.
These are defined in properties, prior to starting the server.
The consumers may vary datasource to datasource.
An example might be UNIX userids.
Consumer names can contain * and ? wildcards,
meaning "zero or more repetitions of any character" and "any character"
respectively.
Finally, entitlements may be defined, so as to say that for a given datasource, for a given resource, a given consumer may legitimately consume an amount of the that resource. Entitlements are defined in properties, prior to starting the server. If it is observed that a consumer consumes more than their entitlement, then this is indicated on the resulting graph by a line across their bar in the histogram.
Given the Concepts listed above, the properties which must be set up match pretty much one-for-one.
The example below shows the configuration for an instance of TrendServer
running on nyangau, reading a samples file in
TrendServers current directory called Sample.log.
It also can access samples from another instance of TrendServer, running on
twiga.
Sampling is every 60s, so I've picked intervals of 65s (to allow for uneveness in the scheduling).
The resources we are tracking are %CPU and %memory.
We've listed the major UNIX userids on each host (and 'other') as the consumers.
On nyangau we've listed some resource entitlements.
In fact this is a nonsense, as this machine has no Solaris Resource Manager
or AIX Workload Manager to attempt to share out and limit machine resources.
Still, it makes the example interesting.
TrendServlet.props :-
# Properties for TrendServlet

name=Andys little empire

# What datasources can we use
# If not specified, default is none!
datasources=nyangau,twiga

# For each, specify the file or http URL to fetch it from
# If omitted, will result in a run time error
datasources.nyangau=Sample.log
datasources.twiga=http://twiga:7777/?a=samples&ds=nyangau

# For each include a label, default is none
datasources.nyangau.label=Primary system
datasources.twiga.label=Secondary system

# Sample interval in seconds, default 60s(+5s)
interval.nyangau=65
interval.twiga=65

# What resources can we graph
# If not specified, default is none!
resources=cpu,mem

# For each one, what is the total amount available, default is 100.0
# If negative numbers are used, TrendServer uses a vertical scale as large
# as the largest sample, and the sum of entitlements (ie: it auto-sizes).
# If each datasource has differing amounts then use
#  resource.nyangau.cpu.total=100
#  resource.twiga.cpu.total=50
# If all datasources have the same amount, then use
#  resources.cpu.total=100
resources.cpu.total=100.0
resources.mem.total=100.0

# Units label, default is none
# If each datasource has differing units, then use
#  resources.nyangau.cpu.units=%
#  resources.twiga.cpu.units=percent
# If all datasources are have the same units, then use
#  resources.cpu.units=%
resources.cpu.units=%
resources.mem.units=%

# Resource value multipliers, default is 1.0
# Can be used in conjunction with .units to make readable output
# eg: if value is in ms, could use .units=s and .multiplier=0.001
#resources.cpu.multiplier=1.0
#resources.mem.multiplier=1.0

# Who are the consumers of the resource
# If not specified, default is none!
# If "other" is included, any samples not associated with those listed
# get lumped into the other consumer.
consumers.nyangau=root,ak,oracle,db2inst1,webuser,other
consumers.twiga=root,ak,test*,other

# What consumers should we ignore in the source data
#consumers-ignore.nyangau=apache*

# For each consumer, state entitlement to resource, default is 0.0
# If entitlements vary by datasource, then use
#  entitlement.nyangau.cpu.ak=30
#  entitlement.twiga.cpu.ak=35
# If all entitlements are the same on each datasource, use
#  entitlement.cpu.ak=30
entitlement.cpu.ak=30.0
entitlement.cpu.root=40.0

# Graph sizes
# If not specified, default is 800x200
graph.w=800
graph.h=200

# Extra documentation
doclink.name=the nyangau homepage
doclink.url=http://nyangau:8080/
Of course, TrendServer can graph any set of resources, consumed by any set of consumers. You just have to write appropriate properties.
TrendServer.props :-
# HTTP
port=7777

# HTTPS
port_ssl=7778
keystore=TrendServer.jks
storepass=password
TrendServer ships with a TrendServer.jks containing a test CA
and a certificate signed by it.
To prevent web browsers from complaining about this, use a real CA and
certificate.
If SSL is not required, comment out port_ssl.
TrendServer requires Java 11 or later.
TrendServer is implemented as a servlet called TrendServlet. This is then hosted in a container, making a trend server. The container accepts the requests from web browsers, and passes these to TrendServlet for processing.
By default, TrendServlet is hosted in the nyangau.se
servlet engine, (available from where TrendServlet is obtained).
This is possible, as TrendServlet only uses a limited subset of the servlet
API.
When using nyangau.se, servlet initialisation time parameters
are already stored in a normal Java properties file (called
TrendServlet.props).
Assuming you've already set up the TrendServlet.props
properties file, you can :-
bin/TrendServer
Point a browser at http://hostname:7777/.
A more conventional approach is to embed TrendServlet into a
web application, and install this into a Servlet Engine such as Tomcat.
The Jakarta Servlet API is needed (eg: Tomcat 10 or later).
Using this approach, all TrendServlet related initialisation parameters can be
set up in the web.xml file, or a single initialisation property
trend.propsfn can be set to the name of a properties file.
This is way overkill for something as trivial as TrendServlet, but this approach may make sense if you already have a container, or wish to integrate this functionality into some larger framework.
The format is zero or more samples, each looking like :-
YYYY MM DD hh mm ss
<Tab>consumer1 consumer1-res1-value consumer1-res2-value
<Tab>consumer2 consumer2-res2-value consumer2-res2-value
YYYY MM DD hh mm ss sets the time of the sample.
<Tab> is a read hard tab character (ASCII code 9).
The next line says that at that time the first consumer was consuming the indicated amounts of the resources given.
A real example, which tracks the usage of %CPU (first resource) and %memory (second resource) by UNIX userid (the consumers), on my UNIX system :-
2002 11 23 20 36 00
<Tab>rpc 0 0.1
<Tab>rpcuser 0 0.1
<Tab>nobody 0 2
<Tab>ak 0 1.9
<Tab>db2inst1 0 9.9
<Tab>daemon 0 0.1
<Tab>xfs 0 0.7
<Tab>root 1.9 7
<Tab>lp 0 0.1
Note: the file must only contain content in this format. Blank lines, or lines with comments are not allowed.
Sample is a simple script for tracking %CPU and %Memory
consumption, aggregated by UNIX userid.
The %CPU reporting is good on Solaris, but on AIX and Linux ps
reports the total percentage of CPU over the lifetime of the process, rather
than an instantaneous sample.
The %Memory reporting is good unless processes share large amounts of memory, as shared memory can be reported multiple times, resulting in values over 100%. eg: the Oracle SGA.
This can be scheduled once every minute or so by adding to a
crontab, something like :-
* * * * * /opt/trendserver/bin/Sample
If you choose a different interval, be sure to update the properties also.
The Trend Server package includes a Linux Sampler which also samples
%CPU and %Memory consumption, and is better than the Sample
script above.
$ nohup ./linuxsampler -i 60 -f Sample.log -s 201000 200000 &
At regular intervals, it reads the /proc filesystem,
and looks at how many jiffies of CPU time has elapsed (since last sample)
and how many jiffies each process has consumed (since last sample).
It can then see what percentage of available CPU each consumed,
in that sampling period (not over the life of the process).
It can still over-report memory usage however.
User guide
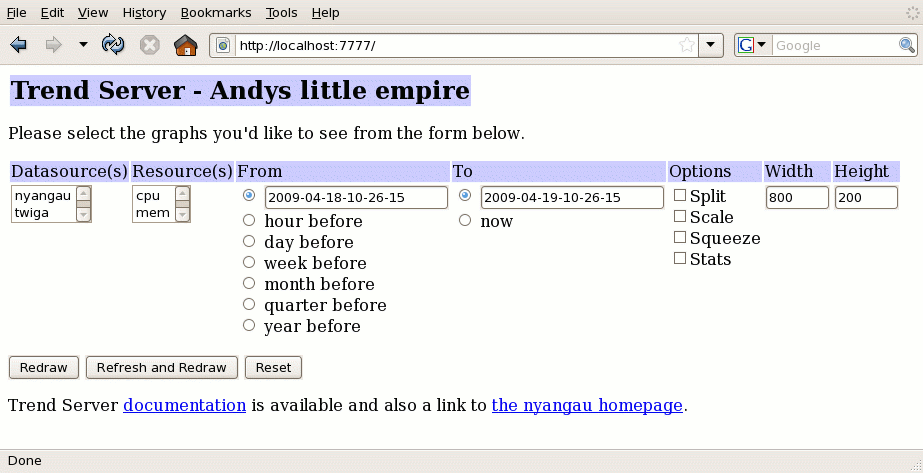
When you first visit the TrendServer page, you'll see :-

You then pick the datasource(s) and resource(s) you'd like to see, and the appropriate time range. Note that all times correspond to sample times as they are recorded, and thus are relative to the timezone of the monitored host, not the local client system, or even the system running TrendServer.
TrendServer caches the samples it has read. If it has data cached, and you select "Redraw", it will not re-read data. If you select "Refresh and Redraw" it discards cached data and re-reads it. You might choose to do this if you wish to see upto date data.
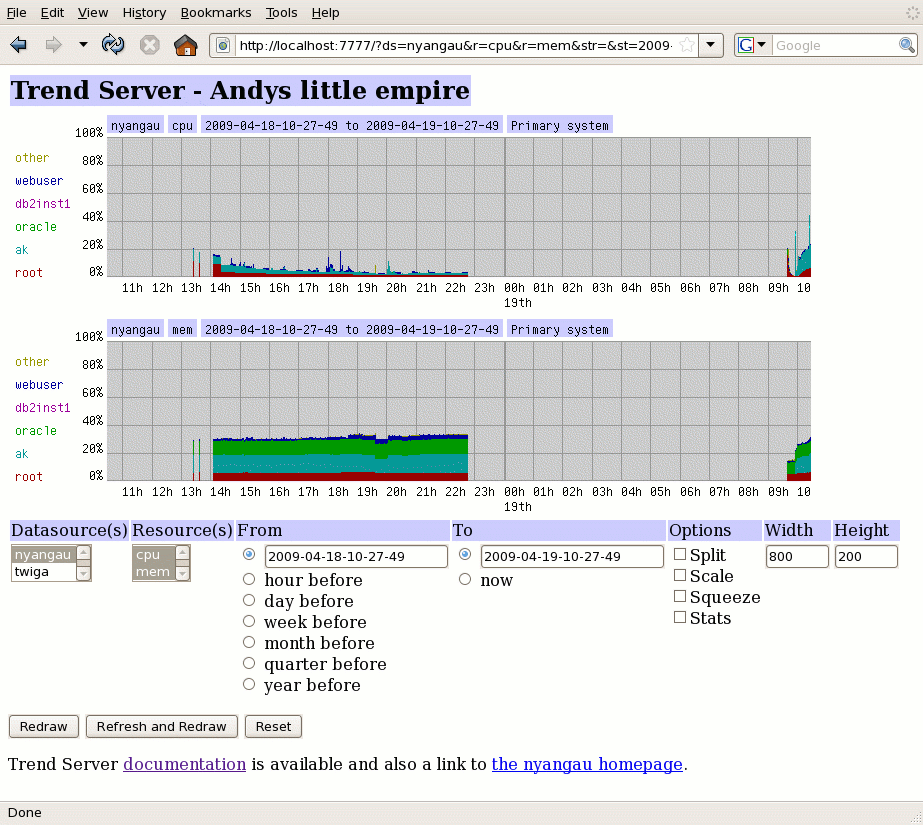
Here we can see that nyangau had been running the previous
afternoon and evening, but after that it wasn't sampling (it was actually
powered down) until 9:30 the next day.
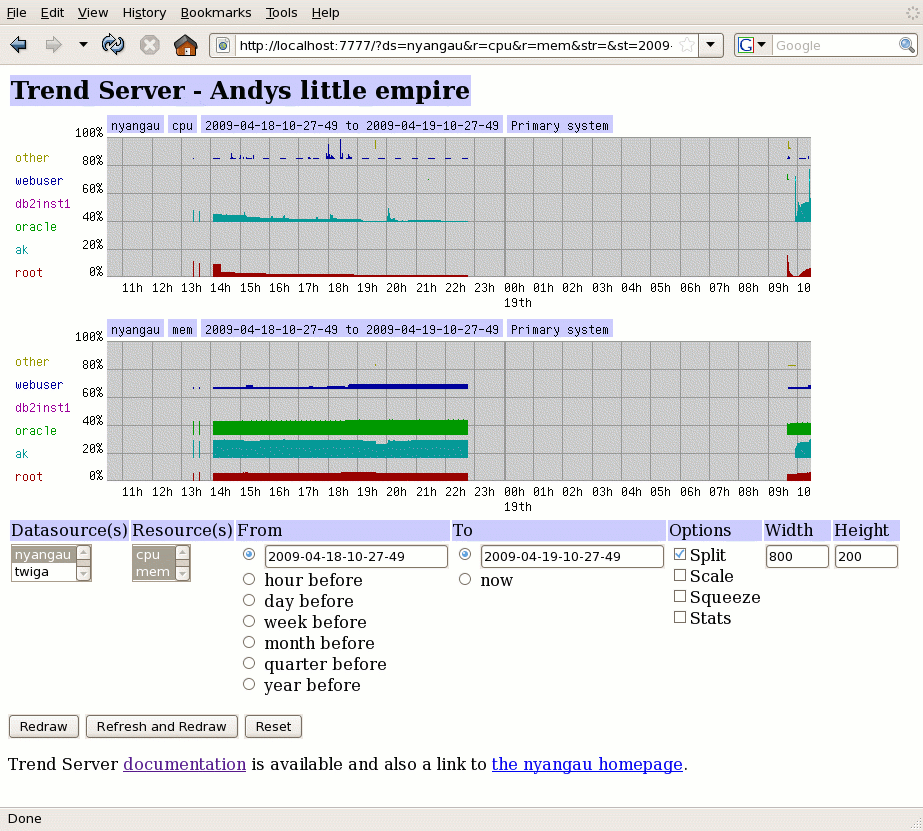
You can elect to split out the consumers into seperate graphs (space allowing), giving a picture much like :-
You can turn on the statistics too :-
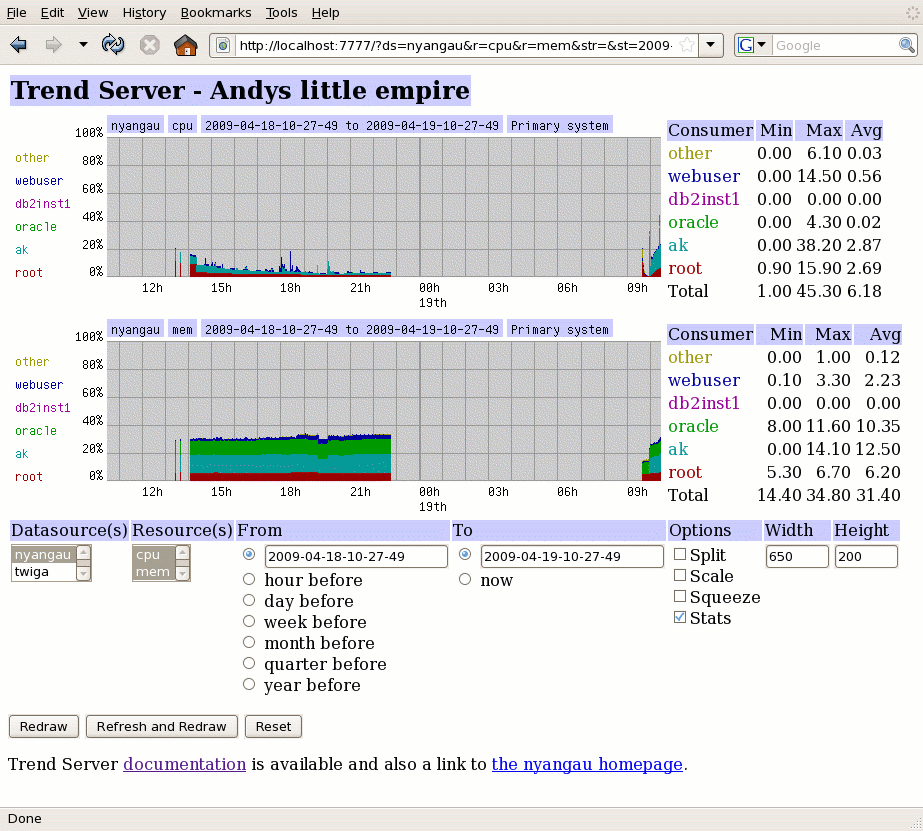
Note that the width of the graphs had been reduced to keep the whole thing nicely within the browser window.
The 'averages' are only computed over the time for which samples exist. The bottom right number is the average of the total, not the total of the averages.
Note: Netscape seems to have a problem with nested table formatting, so we detect the client and in that case we place the statistics below the graph.
The new "samples" checkbox enables buttons next to graphs allowing you to download the source data for that datasource behind the graph (the entire dataset), or download the data on display as a CSV file.
By default, TrendServlet uses the Mini-AWT Java class library in place of
the regular java.awt.* classes.
This is possible as TrendServlet only uses a limited subset of the
AWT API - in particular, just the fillRect and
drawString operations on java.awt.Graphics object.
Use of Mini-AWT allows TrendServlet to make use of its embedded
PngEncoder to encode generated graphs, rather than relying on
Acme.JPM.Encoders.GifEncoder or similar,
and thus also avoids any 'UNISYS LZW / Compu$erve GIF Tax' issues.
Use of Mini-AWT allows TrendServlet to run in environments where AWT is not available or is not operable. UNIX servers in production datacenters often fall into this category. They may choose not to run XWindows, nor be able to reach hosts running XWindows.
If you choose to use real AWT, obtain a copy of the Acme GIF encoder,
and change the lines commented with GIF and PNG in
TrendServlet.java.
You'd also no longer require nyangau-miniawt-<version>.jar.
Feel free to copy, its public domain. Caveat Emptor.